How to Build a Sales Performance Tracking System
How to Build a Sales Performance Tracking System

Sales performance tracking is the practice of collecting, analyzing, and acting on sales data to monitor pipeline health, measure rep productivity, and forecast revenue — and the first three things you should do are pick 3–7 core KPIs, establish baselines for each, and block a recurring weekly review slot on your calendar.
Start with these five KPIs before adding anything else:
- Quota attainment — the percentage of target revenue each rep closes in a period
- Pipeline coverage — total pipeline value divided by the revenue target (aim for three to four times)
- Win rate — closed-won deals divided by total opportunities
- Activity level — calls, emails, and meetings logged per rep per week
- Ramp time — weeks from hire date to first full-quota month
Everything else can wait until these five are clean and consistent.
Key Takeaways
A tracking system only drives results when it connects a small set of high-impact KPIs to a repeatable review cadence and specific coaching actions.
| Point | Details |
|---|---|
| Start with 5–7 KPIs | Choose quota attainment, pipeline coverage, win rate, activity level, and ramp time before adding anything else. |
| Set baselines first | Use 90 days of historical data to establish baselines before judging any metric as good or bad. |
| Automate data capture | Manual reporting breaks at scale; CRM-connected dashboards give reps and managers real-time clarity. |
| Run weekly pipeline reviews | Flag stalled deals and at-risk pipeline every week so problems surface before they cost you the quarter. |
| Link coaching to KPI signals | Low stage conversion is a coaching prompt, not just a number; use scorecards and transcripts to find the root cause. |
| Xl Roleplay closes the evidence gap | Scored roleplay sessions and transcripts connect skill gaps directly to pipeline KPIs, giving managers a defensible coaching case. |
Table of Contents
- What does sales performance tracking actually cover?
- Core KPIs to track: definitions, formulas, and cadence
- How do you set up a sales tracking system in five steps?
- What should your review cadence look like?
- Common tracking mistakes and how to fix them fast
- Which tools should you use for sales tracking?
- How do you measure enablement impact with scorecards and transcripts?
- Your 30/60/90 day action plan
- What managers consistently get wrong about tracking
- Xl Roleplay gives you the evidence layer your tracking system is missing
- Sources
What does sales performance tracking actually cover?
Sales tracking is the process of collecting, analyzing, and acting on sales data to monitor pipeline health, measure performance, and forecast revenue. The practice spans three operational purposes: day-to-day monitoring (is the pipeline healthy right now?), coaching (which reps need help and on what?), and forecasting (will we hit the number?).
Metrics fall into five categories, and knowing which bucket a metric belongs to tells you how often to check it and what decision it should drive.
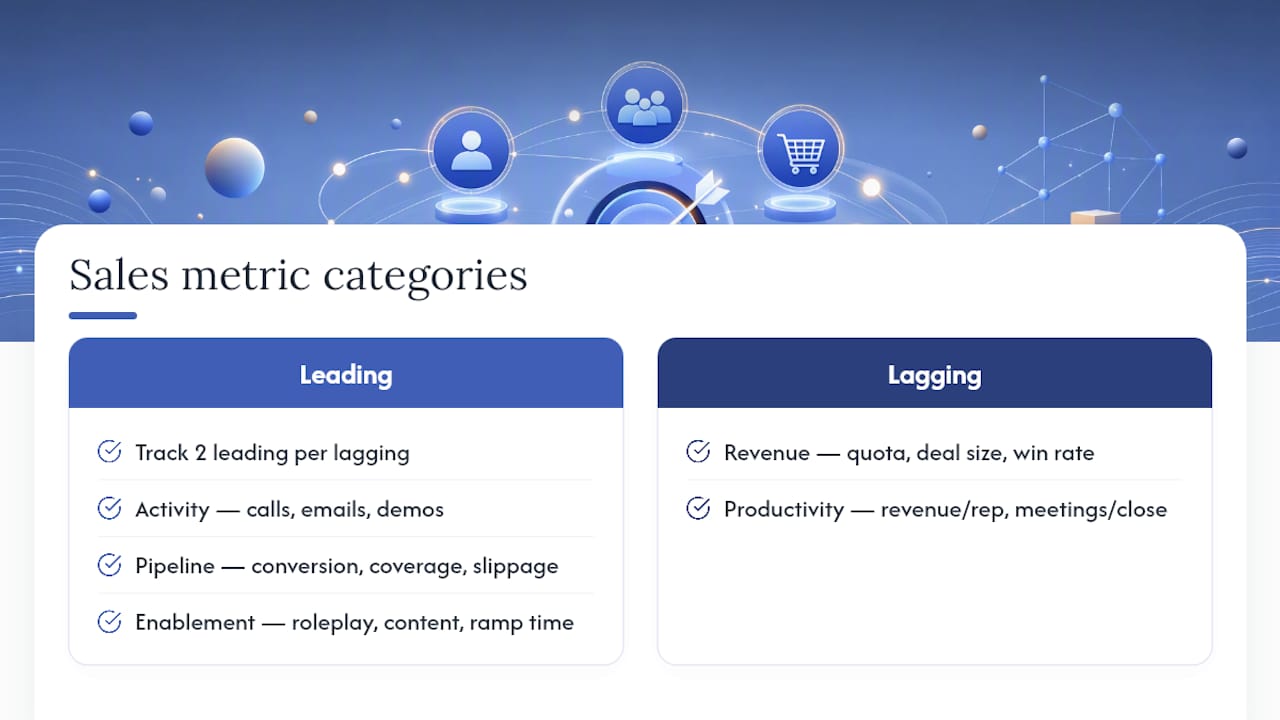
Activity metrics count rep behaviors: calls made, emails sent, demos booked. These are leading indicators — they predict future revenue but don’t measure it yet. Pipeline metrics measure deal flow: stage conversion rates, pipeline coverage, deal slippage. Also leading. Revenue metrics capture closed outcomes: quota attainment, average deal size, win rate. These are lagging indicators — they confirm what already happened. Productivity metrics combine output and input: revenue per rep, meetings per close. Lagging. Enablement metrics measure skill and readiness: roleplay scores, content engagement, ramp time. Leading, and often the most neglected category.
The leading/lagging split matters because lagging indicators tell you a problem happened; leading indicators tell you one is coming. A manager who only watches quota attainment is reading yesterday’s newspaper. Track at least two leading indicators for every lagging one.
Core KPIs to track: definitions, formulas, and cadence
A focused set of 5–10 metrics outperforms tracking every possible number, and enablement research recommends starting with 5–7 KPIs and building baselines over a 30/60/90-day rollout before expanding. The table below gives you the formulas and cadence for the ten most impactful KPIs.
| KPI | Formula | Cadence | Type |
|---|---|---|---|
| Quota attainment | Closed revenue ÷ quota target | Weekly pacing, monthly final | Lagging |
| Win rate | Closed-won ÷ total closed opportunities | Monthly | Lagging |
| Average deal size | Total closed revenue ÷ number of deals | Monthly | Lagging |
| Sales cycle length | Sum of days from open to close ÷ number of deals | Monthly | Lagging |
| Pipeline coverage | Total pipeline value ÷ revenue target | Weekly | Leading |
| Stage conversion rate | Deals advancing to next stage ÷ deals entering stage | Weekly | Leading |
| Ramp time | Days from hire to first full-quota month | Per cohort | Leading |
| Activity level | Calls + emails + meetings logged per rep per week | Weekly | Leading |
| Content engagement | Opens, shares, or time-on-page per asset | Weekly | Leading |
| Deal slippage | Deals that moved past their expected close date ÷ total pipeline | Weekly | Leading |
Priority guidance by situation:
- Thin pipeline: start with pipeline coverage and stage conversion rate. If coverage drops below 3x, you have a prospecting problem, not a closing problem.
- Low win rate: focus on stage conversion rate and average deal size. A win rate below 20% in a competitive market usually points to a qualification or discovery gap.
- Long sales cycles: track deal slippage and sales cycle length together. Slippage above a quarter of pipeline often signals that reps are avoiding hard conversations about timeline.
Speed-to-lead also belongs on your radar as an activity metric. Research on lead response consistently shows that faster follow-up improves conversion rates, making response time one of the most actionable leading indicators a manager can track without touching the CRM’s core pipeline fields.
How do you set up a sales tracking system in five steps?
A tracking system that works is built in a specific order. Skip step two and you’ll instrument the wrong things. Skip step four and you’ll be manually updating spreadsheets at 11 PM on a Sunday.
1. Map your sales process. Write down every stage from first contact to closed-won, with a clear entry and exit criterion for each. If your CRM stages don’t match how deals actually move, fix that first. Garbage-in is the single biggest reason dashboards get ignored.
2. Choose 3–7 core KPIs. Pull from the table above. Pick the metrics that answer the question your team is actually struggling with right now, not the metrics that look impressive in a board deck. Fewer is better at the start.
3. Instrument your data sources. Identify which CRM fields feed each KPI. Make required fields mandatory in the CRM so reps can’t skip them. Assign a data owner for each field — usually the rep for activity data and the manager for stage and close-date fields.
4. Automate capture and calculations. Manual entry is where data quality dies. Use your CRM’s native automation or a connected tool to calculate KPIs automatically. CRM-connected quota attainment dashboards replace fragile spreadsheets with live pacing data, so reps and managers always see where they stand without anyone pulling a report.

5. Build dashboards and schedule reviews. Build five tiles first: quota pacing by rep, at-risk deals (past close date or no activity in 14 days), stage-conversion funnel, rep leaderboard, and ramp progress for new hires. Then put the weekly review on the calendar before you do anything else. A dashboard nobody looks at is just a pretty chart.
Data quality checklist before you go live:
- Required fields defined and enforced in the CRM
- Each field has a named owner
- Deduplication rules set for contacts and accounts
- Refresh frequency documented (real-time vs. nightly sync)
- At least one person responsible for monthly data audits
What should your review cadence look like?
The cadence is where data becomes decisions. Without a structured rhythm, dashboards accumulate and nobody acts on them. A practical coaching cadence pairs three meeting types with clear agendas and decision rules.
Weekly pipeline review (30 minutes, sales manager + reps)
- Flag stalled deals: any deal with no activity in 10+ days gets a next-step commitment before the meeting ends.
- Review at-risk pipeline: deals past their expected close date or with pipeline coverage below 3x get escalated or removed.
- Confirm next-week priorities: each rep leaves with two or three specific actions tied to named deals.
Monthly performance review (60 minutes, sales manager + team)
Cover quota attainment versus target, activity trends by rep, coaching priorities based on stage conversion data, and any skill gaps surfaced by roleplay scores or call recordings. This is where you decide who needs coaching and on what — not just who is behind on quota.
Quarterly business review (90 minutes, sales manager + leadership)
Agenda: forecast versus goal, territory and quota fairness review, hiring and capacity decisions, and any changes to the KPI set or target structure. HBR’s analysis of stretch goals is a useful reference here — unrealistic targets that aren’t supported by capacity and incentives tend to undermine performance rather than lift it.
Analytics-driven review meetings work best when every agenda item maps to a specific metric and a specific decision — not a general discussion of “how things are going.”
Common tracking mistakes and how to fix them fast
Most tracking failures aren’t data problems. They’re design problems.
- Tracking too many KPIs. If your dashboard has 20 metrics, nobody owns any of them. Fix: cut to 5–7, assign an owner to each, and add new metrics only when you’ve proven the existing ones are clean and consistently reviewed.
- Stale or manual data. A weekly report built from a spreadsheet someone updates by hand is already wrong by Tuesday. Fix: automate every calculation you can. If a number requires a human to copy-paste it, it will be wrong eventually.
- Ignoring leading indicators. Watching only quota attainment is like driving by looking in the rearview mirror. Fix: add at least two leading indicators (pipeline coverage and stage conversion rate are the highest-leverage pair) and review them weekly, not monthly.
- Poor CRM hygiene. Reps who don’t trust the CRM don’t update it. Fix: make required fields mandatory, keep the stage list short, and show reps how their own commission tracking depends on accurate data.
- Confusing activity with outcome. High call volume doesn’t mean good calls. Fix: pair activity metrics with conversion metrics so you can see whether the activity is actually moving deals.
Pro Tip: If stage conversion from demo to proposal drops below your baseline, that’s your signal to run a discovery roleplay session before the next pipeline review. Low conversion at that stage almost always traces back to a qualification or needs-analysis gap, not a closing problem.
Which tools should you use for sales tracking?
The right tool depends on team size, data complexity, and how much you’re willing to pay for automation. The table below maps tool categories to their practical trade-offs.
| Tool category | Best for | Key limitation |
|---|---|---|
| Spreadsheets | Teams under 5 reps, early-stage startups | Manual updates, no real-time data, breaks at scale |
| CRM native reporting | Teams already on Salesforce, HubSpot, or Pipedrive | Limited cross-object calculations, no incentive comp |
| BI tools (Tableau, Power BI) | Teams with a data analyst or RevOps function | Requires data modeling expertise and maintenance |
| SPM platforms | Mid-market and enterprise with complex quota/comp plans | Higher cost, longer implementation, change management |
| Enablement/conversation intelligence | Teams focused on coaching and behavior change | Doesn’t replace CRM for pipeline data |
Startups and small teams can start with spreadsheets, but once headcount or plan complexity grows, the manual overhead becomes a liability. Integrated SPM platforms unify quotas, incentives, and analytics so leaders can align planning with execution and run what-if scenarios using live opportunity data — a capability no spreadsheet can replicate.
Enterprise-grade platforms like Oracle Sales Performance Management typically include quota management, incentive compensation, territory management, and real-time dashboards that improve both transparency and forecasting accuracy.
Vendor requirement checklist before you sign anything:
- Real-time or near-real-time data sync with your CRM
- Native integration with your existing tech stack (no manual CSV imports)
- Calculation transparency — reps should be able to see how their numbers are computed
- Audit trail for quota and compensation changes
- Role-based access so reps see their data and managers see the team view
- Mobile-accessible for field teams
When evaluating AI sales roleplay tools as part of your enablement stack, apply the same checklist: ask how scores are calculated, whether transcripts are searchable, and how the tool exports data to your CRM.
How do you measure enablement impact with scorecards and transcripts?
Most teams measure training by completion rate. That’s the wrong metric. Completion tells you a rep watched a video; it tells you nothing about whether they can run a discovery call.
The right measurement framework follows four levels: reaction (did reps find it useful?), learning (can they demonstrate the skill?), behavior (are they applying it in live calls?), and results (did revenue KPIs move?). Each level requires a different measurement window. Reaction and learning show up within the first 30 days. Behavior change takes 30–60 days to appear consistently in call data. Revenue results typically need 60–90+ days to surface in win rate and deal size.
Pre/post baselines and cohort comparisons are the most reliable way to isolate training impact from other variables. Run a pilot with a cohort of 8–12 reps, measure their baseline KPIs for 30 days before training, then track the same KPIs for 90 days after. Compare to a control group if you can.
Sample scorecard items for a discovery call rubric:
- Did the rep ask at least three open-ended discovery questions? (Yes/No + count)
- Talk-to-listen ratio: rep should be under 50% of talk time
- Was the prospect’s key business problem explicitly confirmed? (Yes/No)
- Did the rep handle at least one objection without immediately discounting? (Yes/No)
- Was a clear next step agreed on before the call ended? (Yes/No)
Score each item 0–2 (0 = not present, 1 = partial, 2 = strong). A rep scoring below 6/10 consistently needs coaching on discovery before you address anything else in their pipeline.
Conversation intelligence and roleplay scoring give you behavior-level signals at scale — you can see whether reps are applying what they practiced before it shows up (or fails to show up) in their win rate. That’s the early warning system most teams are missing.
Pro Tip: Link your scorecard data to your CRM by tagging each coaching session with the rep’s open opportunities. When a rep’s discovery score improves by two points, check whether their stage conversion rate from demo to proposal moves within the next 30 days. That correlation, even anecdotally, is the evidence your leadership team needs to fund the next training cycle.
For managers who want to build this into a structured onboarding ramp, the 30/60/90 framework maps directly to the measurement windows above: practice and scoring in the first 30 days, behavior observation in days 31–60, and revenue KPI review at day 90.
Your 30/60/90 day action plan
Use this as your implementation checklist. Assign an owner to each item before the first week is out.
Days 1–30 (Sales Manager owns)
- Map your sales process stages and entry/exit criteria
- Choose 5–7 core KPIs from the table in this guide
- Audit CRM fields and make required fields mandatory
- Set baselines for each KPI using the last 90 days of data
- Schedule weekly pipeline reviews and monthly performance reviews
Days 31–60 (RevOps or Sales Manager owns)
- Automate KPI calculations in your CRM or connected tool
- Build the five core dashboard tiles (quota pacing, at-risk deals, stage funnel, leaderboard, ramp progress)
- Run the first monthly performance review using live dashboard data
- Identify the two or three reps who need coaching and define the skill gap
Days 61–90 (Enablement or Sales Manager owns)
- Launch a roleplay or coaching pilot for the identified reps
- Establish scorecard baselines for discovery and objection handling
- Connect scorecard data to CRM opportunity records
- Run the first quarterly business review with the new KPI framework
- Measure rollout success: are reviews happening on schedule? Is CRM data quality improving? Are leading indicators moving?
The measure of a successful rollout isn’t a perfect dashboard. It’s whether your weekly pipeline review is producing specific next steps that actually get executed.
What managers consistently get wrong about tracking
Most sales managers I’ve seen build tracking systems make the same mistake: they treat the dashboard as the destination. They spend weeks getting the charts right and then wonder why nothing changes. The dashboard is a diagnostic tool, not a management system.
The shift happens when a manager looks at a low stage-conversion number and immediately asks, “What did that rep say in the last three demos?” rather than “How do we fix the conversion rate?” Transcripts and scorecard data make that question answerable in five minutes instead of five days. When managers can point to a specific moment in a specific call and say, “Here’s where we lost the deal,” coaching becomes concrete. Reps stop feeling judged by a number and start feeling helped by evidence.
The practical suggestion: in your next one-on-one, pull one transcript or roleplay recording before the meeting. Find one specific moment where the rep could have asked a better question or handled an objection differently. Build the whole coaching conversation around that moment. One concrete example beats thirty minutes of quota talk every time.
Xl Roleplay gives you the evidence layer your tracking system is missing
Most tracking systems tell you what happened in the pipeline. Xl Roleplay tells you why — by scoring every practice conversation against your sales methodology and surfacing the exact skill gaps that are dragging down your win rate and deal size.
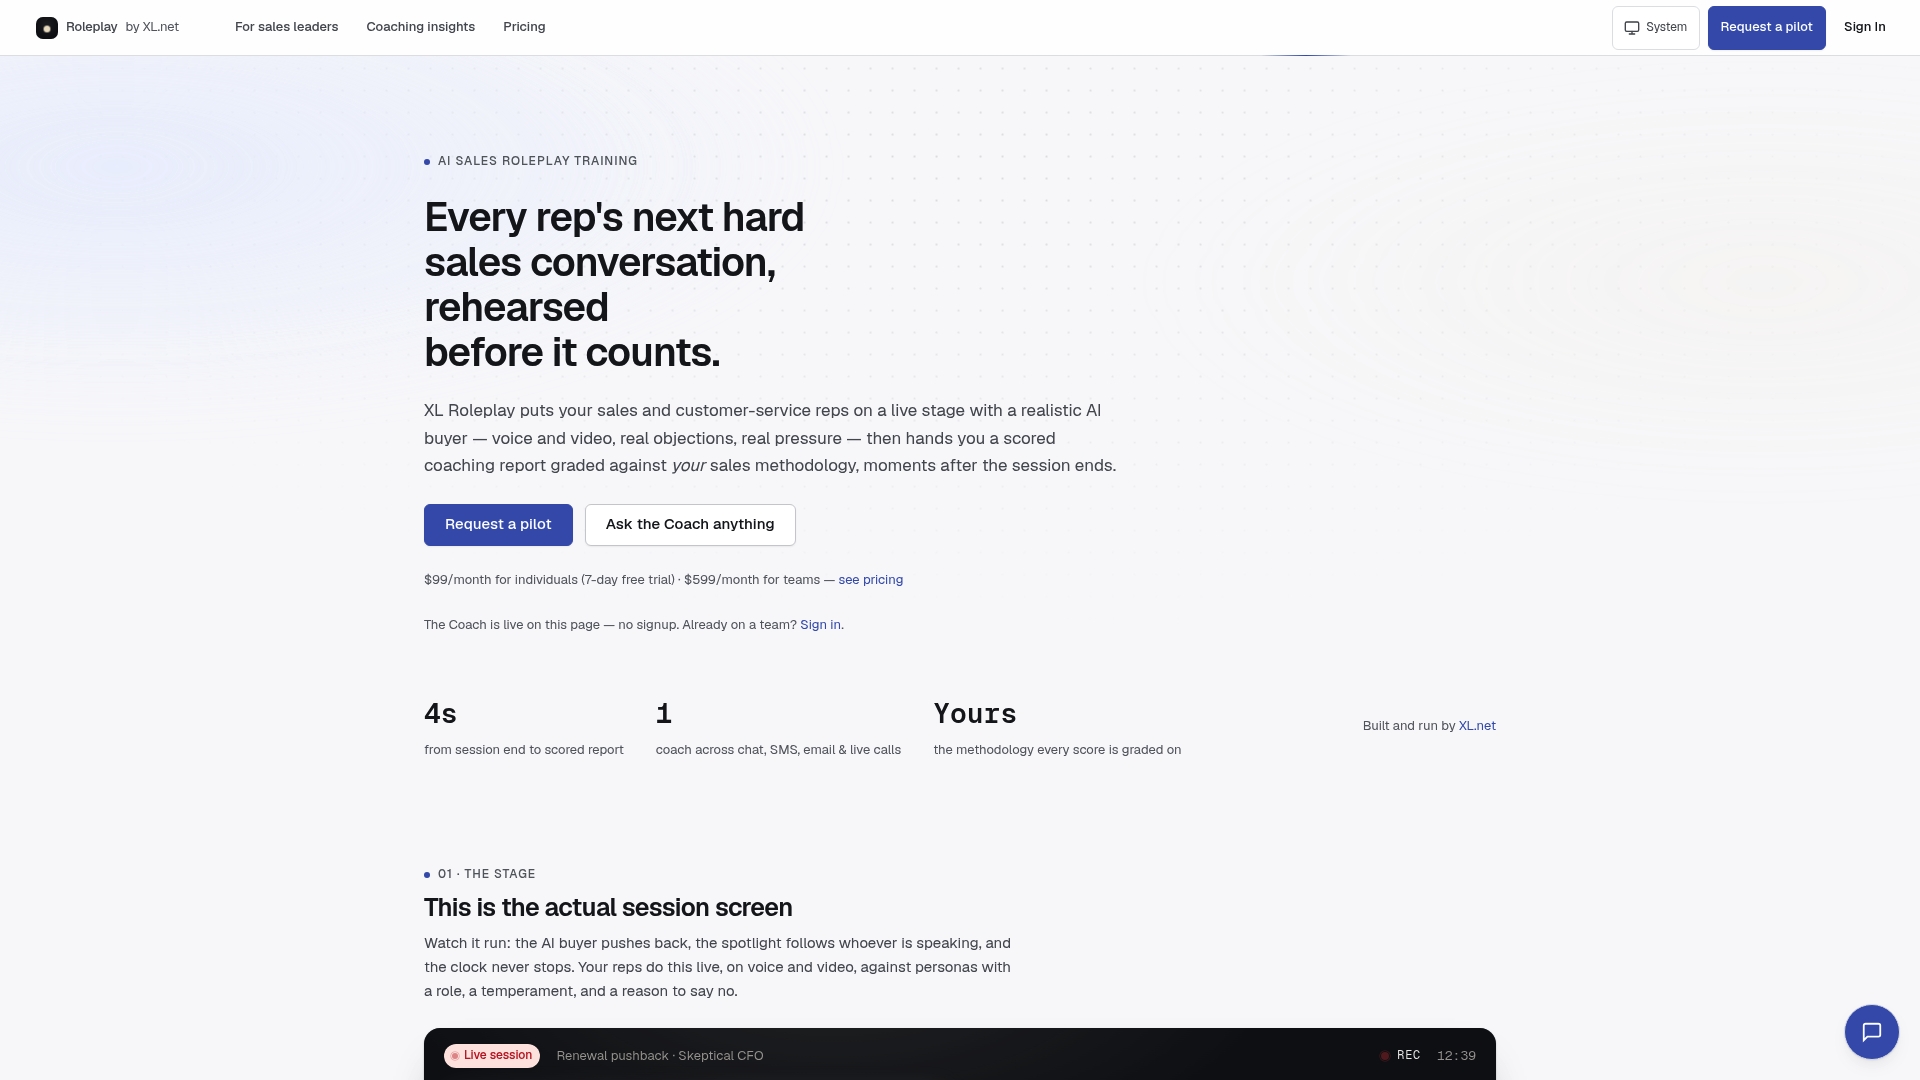
The platform runs live voice and video roleplay sessions with realistic AI buyers, scores each session against your organization’s rubric, and delivers transcripts and coaching reports your managers can act on the same day. For a pilot, start with a cohort of 8–12 reps, run four to six roleplay sessions over 30 days, and track their stage conversion rate and discovery scores against a baseline. At day 90, compare their win rate and average deal size to the control group. That’s a measurable, defensible ROI case your leadership will fund again.
Sales leaders can explore Xl Roleplay’s features and start a trial to see how scored coaching reports and readiness tracking integrate with the KPI framework in this guide.
Sources
The sources below back the frameworks, formulas, and recommendations in this guide.
- Sales Enablement KPIs: The Ultimate Guide to Measuring Impact
- Sales tracking done right gives you real-time visibility into every deal…
- Can your sales team actually achieve their stretch goals? - HBR