Sales Practice Metrics: A 90 Day Coaching Plan for Managers
Sales Practice Metrics: A 90 Day Coaching Plan for Managers

Track pipeline created per rep, stage conversion rate, win rate, average deal size, sales cycle length, quota attainment, ramp time, and activity-to-outcome ratio. Review activity metrics weekly, performance metrics monthly, and strategic or efficiency metrics quarterly. This guide covers how to measure each one, build dashboards around them, and connect practice to the numbers that move.
TL;DR:
- A coaching study identified 18 coachable skills; 3 to 5 monthly hours of quality coaching per rep was a benchmark for moving underperformers toward quota.
- Coach one skill at a time, score practice against a behavior based rubric, and rerun the scenario within days to track improvement.
- Test whether leading practice signals predict stage outcomes across full sales cycles, and keep only measures that show a relationship.
- Exclude reps still within their ramp window from veteran benchmarks, and compare new hires only with peers at the same tenure point.
- Set targets from historical cohort ranges, test them for 6 to 8 weeks, and pilot the approach with two or three reps before wider rollout.
Table of Contents
- Core sales practice metrics: definitions, quick formulas, and what each reveals
- A tiered framework for prioritizing metrics
- Using metrics to drive coaching and sales practice improvements
- Dashboards and reports that make sales practice metrics actionable
- Cadence, targets, and benchmarking: when to review metrics and how to set targets
- Common mistakes and how to avoid them
- A short, practical 90-day playbook
- An operational option: measuring practice without the manual grind
- FAQ
- Sources
Core sales practice metrics: definitions, quick formulas, and what each reveals
Every sales organization tracks too many numbers and acts on too few. The metrics below separate the ones worth a manager’s weekly attention from the ones better suited to a quarterly review.
Pipeline created per rep measures new qualified opportunity value generated in a period, divided by the rep. It forecasts future capacity before a single deal closes, which makes it a leading indicator. A sudden drop usually means prospecting activity fell, not that deals are harder to close.
Stage conversion rate is the percentage of opportunities that move from one pipeline stage to the next. The formula is simple: opportunities advancing divided by opportunities entering that stage. When conversion drops at a specific stage across multiple reps, the problem is usually a skill gap tied to that stage, such as discovery or negotiation, rather than a market shift.
Win rate is closed-won deals divided by total closed deals (won plus lost), usually calculated over a trailing period. It’s a lagging indicator: useful for judging outcomes, but it tells you nothing about why a rep is winning or losing without a diagnostic layer underneath it.
Average deal size is total revenue divided by number of closed deals. Watch this alongside win rate. A rep who wins often but at a shrinking deal size may be discounting to close, which shows up in margin before it shows up in a dashboard.
Sales cycle length tracks average days from opportunity creation to close. Longer cycles aren’t automatically bad, but a cycle that’s stretching for a specific rep or segment often signals stalled deals that need manager intervention before they go cold.
Quota attainment is actual results divided by assigned target, typically tracked monthly and quarterly. It’s the headline lagging metric, but it’s most useful when read next to ramp time and pipeline created, since those explain whether a miss is a short-term dip or a structural problem.
Ramp time measures how long a new rep takes to reach full productivity, usually defined as consistent quota attainment. Shorter ramp time means faster payback on hiring, and it’s one of the clearest signals of whether onboarding and coaching are working.
Activity-to-outcome ratio compares raw activity (calls, emails, meetings booked) to the outcomes those activities produce (meetings held, opportunities created). It’s the single best defense against mistaking busyness for productivity.
Here’s how these metrics break down by type and what triggers action:
- Leading indicators (pipeline created, activity-to-outcome ratio): act when the trend breaks, not when a single week looks off.
- Lagging indicators (win rate, quota attainment, average deal size): act when a pattern holds across a full cycle or quarter.
- Efficiency and ramp metrics (sales cycle length, ramp time): act when a cohort, not just one rep, deviates from historical norms.
Each of these numbers means little in isolation. The value comes from reading them together, which is what the tiered framework below is built to do.
A tiered framework for prioritizing metrics
Gartner’s guidance on sales productivity recommends organizing metrics into three tiers rather than tracking a flat list, because flat lists tend to bury the signals that actually drive coaching decisions.
Tier 1: productivity and outcome metrics. This is quota attainment, total revenue, and win rate: the scoreboard numbers executives and boards care about. They tell you what happened, not why.
Tier 2: lagging indicators. Stage conversion rate, average deal size, and sales cycle length sit here. They’re more diagnostic than Tier 1 but still describe the past.
Tier 3: leading indicators. Pipeline created, activity-to-outcome ratio, discovery call depth, and interaction quality scores live in this tier. These are the metrics that predict Tier 1 and Tier 2 outcomes before they happen, and they’re the ones coaching can actually move in the short term.
The reason Tier 3 matters so much for managers is that it’s the only tier you can influence this week. You can’t coach a rep into a higher win rate directly. You can coach them into better discovery questions, which shows up in stage conversion a few weeks later, which eventually shows up in win rate.
A practical way to find out which Tier 3 metrics matter for a given team is to run a short test:
- Hypothesize which Tier 3 signals you believe predict outcomes, such as account reach, meeting engagement quality, or average interaction value.
- Test the correlation between those signals and Tier 2 outcomes over a defined window, long enough to span a few full sales cycles.
- Adopt the Tier 3 metrics that show the strongest relationship to outcomes, and drop the ones that don’t, rather than tracking everything by default.
Interaction-based leading indicators deserve particular attention because they capture quality, not just volume. Account reach measures how many stakeholders within a target account a rep has engaged. Engagement depth measures how substantive those conversations are. Average interaction value estimates the revenue potential tied to each conversation. Together, these indicators flag which reps are spending time on the right accounts long before a deal shows up as won or lost.
Using metrics to drive coaching and sales practice improvements
Metrics only matter if they change what a manager does in the next coaching conversation. A multi-year coaching study that distilled 172 sales skills down to 18 high-impact, coachable skills found that focused manager-led coaching produced measurable skill improvement and revenue gains, with 3 to 5 hours of quality coaching per rep per month a reliable benchmark for moving underperformers toward quota.
Two things matter in that finding: the coaching has to be quality, not just logged hours, and it has to target a small number of skills rather than everything at once. Trying to fix discovery, objection handling, and closing simultaneously tends to produce no measurable improvement in any of them.
That means practice itself needs its own metrics, separate from outcome metrics. Useful signals include:
- Interaction quality score, a rubric-based rating of how well a rep handled a call or roleplay, scored against specific behaviors rather than a gut impression.
- Objection-handling score, tracking how effectively a rep addresses specific objection types over repeated practice runs.
- Discovery depth, measuring how many layers of a prospect’s situation a rep uncovers before pitching a solution.
- Deliberate practice run count, the number of focused practice repetitions a rep completes on a targeted skill in a given week.
The payoff is a direct line from practice scores to pipeline numbers. A rep whose discovery depth score improves over a few weeks should show improved stage conversion at the discovery-to-demo stage within the next cycle. A rep whose objection-handling score improves should show fewer deals stalling at the negotiation stage. When that link doesn’t show up, the coaching focus was probably misaligned with the actual sticking point in the pipeline.
A workable manager workflow looks like this: review a call or practice transcript, score it against a rubric tied to one or two target skills, assign a short micro-practice drill on the weakest behavior, have the rep re-run a similar scenario within days rather than weeks, and measure the score delta. Building scenarios from real call patterns keeps the practice relevant to what reps actually face, and a structured debrief and re-run process turns a single coaching session into a repeatable loop instead of a one-off conversation.
Pro Tip: Score one skill per practice session, not three. A focused rubric produces a clearer delta and a faster coaching cycle than trying to grade everything at once.

Dashboards and reports that make sales practice metrics actionable
A dashboard only earns its place if someone changes behavior because of what it shows. HubSpot’s guidance on sales performance metrics and Salesforce’s sales KPI framework both recommend building dashboards by audience rather than one master view for everyone.
A workable set looks like this:
- State-of-the-union dashboard for leadership: quota attainment, total pipeline, win rate, average deal size, filtered by team and region.
- Pipeline dashboard for managers: pipeline created per rep, stage conversion rates, deals stalled by stage, filtered by tenure and product line.
- Team activity dashboard for frontline managers: activity-to-outcome ratio, meetings booked, interaction quality scores, filtered by role.
- Rep drilldown view for coaching conversations: individual ramp status, practice scores, objection-handling trends, filtered by skill focus.
- Leaderboard for motivation: win rate and quota attainment by rep, filtered by cohort to avoid comparing ramping reps against veterans.
A few practical notes make these dashboards hold up over time:
- Automate the feed by connecting CRM data, call transcription, and practice platform scores rather than compiling numbers by hand each week.
- Filter by cohort, not just by team, since a blended average across new and tenured reps hides who actually needs coaching.
- Watch for averages that mask variance: a team average win rate can look healthy while two reps carry the whole number and three others are underwater.
Reporting these numbers upward works best when the report ties practice activity to outcome movement rather than presenting practice hours as an end in themselves.
Cadence, targets, and benchmarking: when to review metrics and how to set targets
Metric class should dictate review frequency, not habit. Salesforce’s KPI guidance recommends aligning cadence to metric type.
- Weekly: activity and leading indicators, pipeline created, activity-to-outcome ratio, interaction quality scores.
- Monthly: performance metrics, stage conversion, average deal size, quota attainment pacing.
- Quarterly: strategic and efficiency metrics, sales cycle trends, ramp time cohorts, territory-level benchmarking.
For benchmarking, a comparative seller performance index, or CSPI, compares an individual rep’s metrics against a peer cohort rather than a single fixed target. This approach surfaces which specific activities separate top performers from the middle of the pack, which is more useful for coaching than a flat quota number.
One common error is comparing ramping reps against steady-state veterans in the same benchmark. A simple fix: exclude any rep still inside their defined ramp window from cohort averages, and benchmark them only against other ramping reps at the same tenure point.
When setting targets, anchor them to the realistic range your own historical cohort data shows, then revisit after a short test period, six to eight weeks is usually enough, to recalibrate based on what the data actually supports rather than what looked good in a planning meeting.
Common mistakes and how to avoid them
- Mistaking busyness for productivity: high call volume with low connect rates means the activity-to-outcome ratio is broken, not that the rep is working hard.
- Over-indexing on lagging metrics: watching revenue alone without a diagnostic layer underneath leaves you unable to explain a miss until it’s too late to fix.
- Comparing unlike cohorts: a new hire’s numbers next to a five-year veteran’s distorts both benchmarks; segment by role and tenure instead.
- Counting coaching hours instead of coaching quality: logging 1:1 time means little without a rubric showing whether the right skill was actually addressed.
A short, practical 90-day playbook
Start by picking three priority metrics: one Tier 1 outcome, one Tier 2 diagnostic, and one Tier 3 leading indicator tied to a specific practice behavior. Run a 6 to 8 week correlation test to see whether your chosen Tier 3 metric actually predicts the Tier 2 outcome for your team, not just in theory.
Put pipeline created per rep and one interaction-quality metric on the weekly manager report immediately. They’re the fastest signals to catch a problem before it shows up in quota attainment weeks later. Embed the Tier 3 metrics directly into 1:1 conversations rather than reviewing them separately from coaching.
Before scaling any of this across a larger team, run it as a small pilot with two or three reps first. Proving the link between practice and outcome on a small group protects you from rolling out a coaching framework that doesn’t actually move the numbers.
— Adam
An operational option: measuring practice without the manual grind
Everything described above depends on having consistent, scored data on how reps actually perform in practice, not just how they perform in live deals — a challenge that modern platforms focused on ventas y leads are increasingly addressing with AI-enabled sales agent teams. Capturing that by hand, through manual call reviews and spreadsheet rubrics, is where most coaching programs stall out.
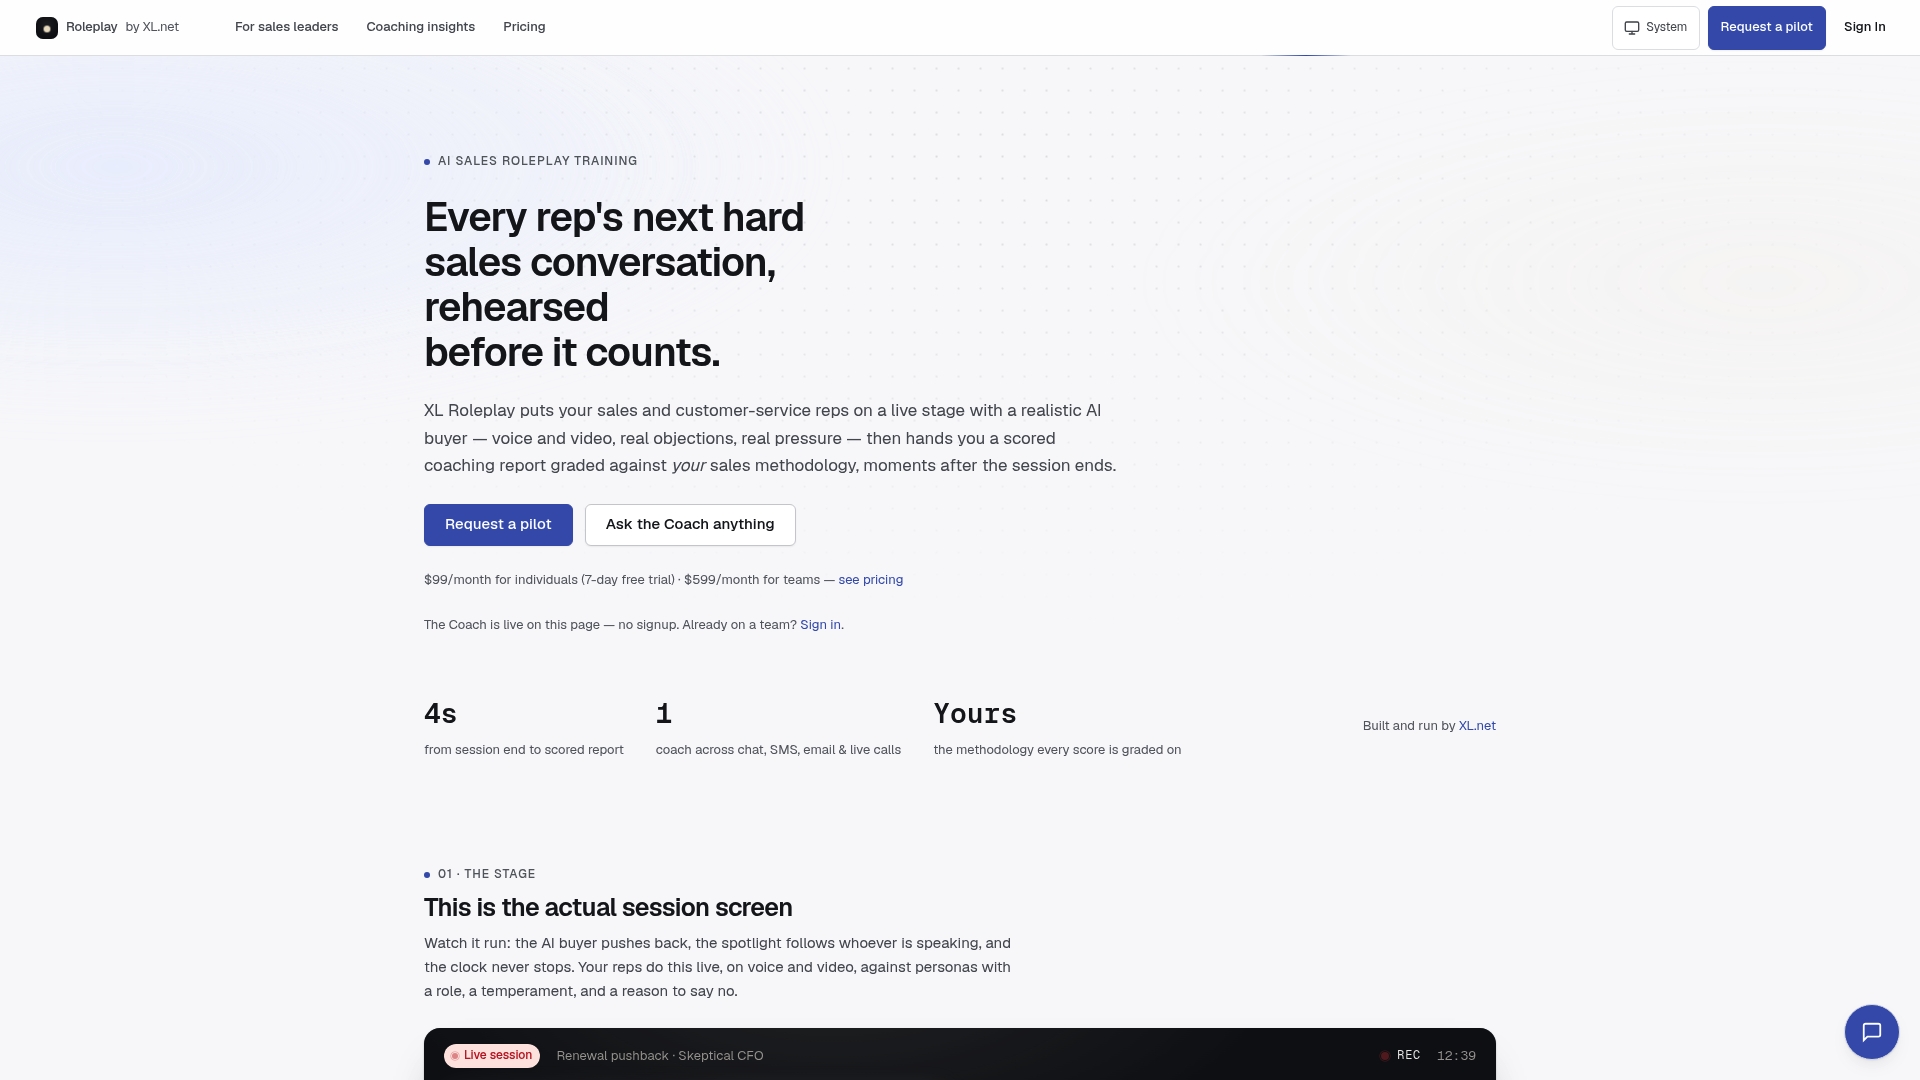
XL Roleplay runs live voice and video practice sessions against AI buyers that present the objections and pressure reps actually face, then scores each session against your organization’s own sales methodology rather than a generic rubric. Every session produces a transcript and a coaching report tied directly to the skills we talked about above.
That setup surfaces the exact Tier 3 metrics this guide covers, without the manual work:
- Interaction quality scores generated automatically from each practice session, tied to the specific skill rubric your team uses.
- Readiness scores that show whether a rep is prepared for a live conversation before they’re in front of a real prospect.
- Transcript-linked coaching actions, so a manager can jump straight to the moment in a session where a skill broke down instead of re-listening to an entire call.
For managers who want to see how this fits a specific team’s methodology, our pricing page lists the Individual and Business plans, and our pilot program gives a low-risk way to test the approach with a small group before rolling it out further. Our overview for sales leaders covers how the scoring and reporting map onto the kind of dashboards described earlier in this guide.
FAQ
What is the 3-3-3 rule in sales?
Definitions of the 3-3-3 rule vary by organization, and it isn’t a standardized industry framework with one fixed meaning. A common version ties it to structuring the first weeks of a sales cycle or ramp period into three-stage blocks, but teams should confirm the specific definition their own sales leadership uses before applying it.
What are some good sales metrics?
Core metrics worth tracking include pipeline created per rep, stage conversion rate, win rate, average deal size, sales cycle length, and quota attainment, reviewed on a cadence matched to each metric’s type. Pairing these outcome metrics with leading indicators like activity-to-outcome ratio gives a fuller picture of both results and the behaviors driving them.
What are the 5 C’s of sales?
Definitions of the “5 C’s of sales” vary across sources and aren’t tied to one standardized framework, so there’s no single canonical list to point to. Sales teams are better served focusing on measurable skills like discovery, objection handling, and negotiation, which tie directly to the stage conversion and win rate metrics covered in this guide.
What is the 30-60-90 rule in sales?
Ramp time is commonly measured in distinct phases over the initial months of onboarding, used to judge whether a new hire is reaching full productivity on the expected timeline. It’s commonly paired with other metrics to judge whether a new hire is reaching full productivity on the expected timeline.
How often should sales managers review performance metrics?
Review cadence should match the metric type: weekly for activity and leading indicators, monthly for performance metrics like stage conversion and quota pacing, and quarterly for strategic metrics like sales cycle trends and territory benchmarking. This tiered cadence keeps managers acting on fresh signals without over-reacting to normal week-to-week noise.
Sources
- The million-minute sales truth (Kent Academic Repository)
- Maximizing Sales Efficiency: A Deep Dive Into Performance Metrics (Gartner excerpt)
- Sales performance metrics (HubSpot)
- Sales KPIs (Salesforce)