Revenue per Rep: Prove Sales Training ROI to Your CFO in 90 Days
Revenue per Rep: Prove Sales Training ROI to Your CFO in 90 Days

Yes, sales training delivers measurable ROI, but only when you measure it correctly. Start with one metric: Revenue per Rep. Establish a baseline before training begins, run a focused pilot cohort, and give it 90 to 180 days before drawing conclusions about revenue impact.
TL;DR:
- Focusing on revenue per rep, establishing a baseline before training, and waiting 90 to 180 days ensures accurate measurement of training impact.
- Use control cohorts and tiered metrics to isolate training effects from market changes or seasonality, especially in business impact measurements.
- Applying conservative attribution, such as 25% to 50%, prevents inflated ROI estimates and produces more defensible financial results.
- Continuous coaching, targeted modules, and AI roleplay improve skill transfer and provide measurable capability gains within weeks.
- Integrating training metrics into sales performance systems and tracking activity, capability, and revenue data together strengthens ROI verification and budget justification.
Table of Contents
- What is training ROI in sales, and how do you calculate it?
- How long does it take to see results from sales training?
- How do you calculate the dollar value of a training program?
- How can you design sales training to actually improve ROI?
- How does AI roleplay create defensible training metrics?
- What should you do in the next 30, 90, and 180 days?
- What gets sales training ROI measurement wrong?
- What do real training ROI results look like?
- Why does qualitative feedback still matter next to hard numbers?
- Which ROI calculation method should you use?
- How does training ROI fit into overall sales performance management?
- What tools help you track and measure training ROI?
- The measurement problem nobody wants to admit
- Put measurement-first training to work with XL Roleplay
- Sources
What is training ROI in sales, and how do you calculate it?
The formula is simple: (Incremental revenue minus total training cost) divided by total training cost, times 100. The hard part is defining the two numbers correctly.
Incremental revenue is the additional revenue you can reasonably attribute to the training, not total revenue for the period. Total training cost includes far more than the invoice. It covers trainer fees or platform subscriptions, rep time away from selling, manager time spent coaching and reviewing, and materials or content development. Skip the indirect costs and your ROI number will look inflated the moment a CFO asks about fully loaded cost.
Once you have both sides of that equation, track the KPIs that actually move it:
- Revenue per rep (RPR): total revenue divided by headcount, the cleanest role-comparable metric for isolating training impact.
- Win rate: percentage of qualified opportunities that close, sensitive to discovery and objection-handling skill.
- Average deal size: reveals whether reps are negotiating value instead of discounting.
- Sales cycle length: shorter cycles free up rep capacity without adding headcount.
- Time-to-quota: how fast new hires reach full productivity, a direct signal of onboarding effectiveness.
Every one of these feeds the ROI formula. None of them means much in isolation.
How long does it take to see results from sales training?
Measurement only works if you organize it by tier and give each tier the right time window. Trying to prove revenue impact in week two is the fastest way to kill a program leadership would otherwise fund.
- Tier 1, activity metrics (roughly 30 days). Completion rates, practice frequency, and roleplay session counts tell you whether reps engaged with the training at all. These are leading indicators, not proof of anything, but a program with weak activity metrics almost never produces strong business results later.
- Tier 2, capability metrics (30 to 90 days). Assessment scores, call quality ratings, and objection-handling scores measured against a pre-training baseline show whether skills actually changed. This is where pre/post baselines and cohort comparisons start to matter, since capability gains without a comparison point are just anecdotes.
- Tier 3, business impact metrics (90 to 180 days). Win rate, RPR, and time-to-quota shift here, measured against an untrained or later-cohort control group to isolate the training’s effect from market conditions, seasonality, or a pricing change that landed the same quarter.
Set up your control cohort before training starts, not after. A staggered rollout, where one team trains this month and another trains next quarter, gives you a built-in comparison group without holding anyone back indefinitely. Skip this step and every result you report later will invite the obvious objection: how do you know it was the training?
How do you calculate the dollar value of a training program?
Here is the math in practice. Average deal size is $20,000, and the team worked 200 qualified opportunities in the measurement window.
At $20,000 per deal, that is $320,000 in gross incremental revenue. Most CFOs will not accept that number, and they would be right not to.
- Apply conservative attribution of 25% to 50% of the measured gain, since pricing changes, market shifts, and product updates also move win rates during the same window.
- At 35% attribution, incremental revenue drops to $112,000, still well above the $40,000 cost.
- ROI at that conservative figure comes out to 180%, a number that survives scrutiny in a leadership meeting.
Statistic to know: Industry benchmarks put average training ROI around 353%, or roughly $4.53 returned per $1 invested. Treat that as a reference point for what strong programs achieve over time, not a guarantee for your next quarter.
How can you design sales training to actually improve ROI?
Most training underperforms not because the content is bad but because it targets the wrong gap or stops the moment the session ends. Fixing both problems is where the real ROI gains live.
Start by assessing skill gaps with data, not instinct. Pull recent call recordings, deal-loss reasons, and manager feedback, then align the next training cycle to your top three business priorities instead of trying to cover everything at once. A team losing deals at the negotiation stage does not need a refresher on cold-call scripts.
- Build targeted modules around the specific gap, not a generic curriculum.
- Add coaching touchpoints every one to two weeks after the initial session, since training paired with ongoing coaching produces far larger performance gains than training alone.
- Use repeated practice, roleplay, and immediate scored feedback so skills transfer to real calls faster than passive content ever will.
- Track cost per format, in-person workshops, e-learning modules, live coaching, so you can compare ROI across formats and shift budget toward whichever one produces results fastest.
Pro Tip: Run the same skills assessment before and after training on a small pilot group first. If the pilot cohort doesn’t show a capability lift within 90 days, don’t scale the program, fix it.
Reinforcement is not optional. A single workshop with no follow-up coaching almost always underperforms a shorter program with weekly practice built in.
How does AI roleplay create defensible training metrics?
Most ROI measurement fails at the capability stage, not the revenue stage. Managers know a rep closed more deals, but they cannot point to evidence that a specific skill improved before it showed up in the pipeline. That gap is exactly what live practice environments are built to close.
XL Roleplay puts reps into realistic voice and video conversations with AI buyers that raise the same objections and pressure points they face in real deals. Every session generates a scored coaching report tied to the organization’s own sales methodology, not a generic rubric, along with a full transcript a manager can review line by line.
That combination turns capability into something you can actually measure against a baseline:
- Readiness scores taken before and after a training cycle give you the Tier 2 capability metric that most programs never capture cleanly.
- Session transcripts and rubrics let managers audit exactly where a rep struggled, whether it’s discovery questions or price objections.
- Score deltas across a cohort show skill improvement at the team level, the same data you need to compare a trained group against a control group.
- Practice frequency data doubles as the Tier 1 activity metric that predicts whether capability gains are likely to show up at all.
What should you do in the next 30, 90, and 180 days?
Every program needs a clock attached to it, or it drifts until someone asks for results that were never being tracked.
- Days 1 to 30: Set your baseline. Pick a pilot cohort, record current RPR, win rate, and skill assessment scores, then begin tracking activity metrics like practice frequency and completion.
- Days 30 to 90: Report leading indicators. Share capability score improvements and early behavior change with leadership, framed as preliminary signals, not final ROI.
- Days 90 to 180: Deliver the full calculation. Compare the trained cohort against your control group, apply conservative attribution, and recommend whether to scale, adjust, or pause the program.
When you present to leadership, lead with the headline format executives actually want: incremental revenue in dollars, ROI as a percentage, and payback period in days; understanding the ROI for getting a GSA contract can help frame these discussions effectively. Everything else is supporting detail.
What gets sales training ROI measurement wrong?
The most common failure is starting the program before anyone agrees on what “success” means. Teams roll out training, wait a quarter, then scramble to reconstruct a baseline from memory or incomplete CRM data. Without a documented pre-training measurement, there is no way to isolate the training’s effect from a market upswing, a new competitor exiting the field, or a pricing change that landed the same month.
A second pitfall is relying on satisfaction surveys, the “smile sheets” reps fill out right after a session, as if they were proof of impact. High satisfaction scores tell you the room enjoyed the workshop. They say nothing about whether win rates moved.
Attribution creep is the third problem. It’s tempting to credit training with 100% of a revenue increase when a dozen other factors, seasonality, a new product feature, a competitor’s price hike, were happening at the same time. Reporting inflated numbers works once. The second time results come up short of that inflated baseline, the whole program loses credibility with leadership.
Finally, many teams measure only lagging indicators and give up when nothing shows in the first month. Business impact metrics like win rate and RPR typically need 90 to 180 days to move in a statistically meaningful way. Checking too early and canceling a program based on a 30-day snapshot throws away results that were still developing.
What do real training ROI results look like?
Concrete numbers make the abstract formula easier to trust. Consider a mid-size B2B sales team of 20 reps where leadership tracked RPR before and after a structured objection-handling and discovery program.
Translating the faster ramp into dollars means estimating each rep’s monthly quota contribution and multiplying it by the months saved, a calculation that often produces a larger dollar figure than the win-rate gain alone.
The pattern that shows up across these examples is consistent: programs that measure a baseline, isolate a control cohort, and pair initial training with ongoing coaching post stronger, more defensible numbers than one-off workshops measured only by post-session surveys.
Why does qualitative feedback still matter next to hard numbers?
Numbers tell you what changed. They rarely tell you why. A win rate that climbs 6 points is a fact worth reporting, but manager notes on which specific objection reps now handle better turn that fact into something you can replicate in the next training cycle.
Build qualitative review into the same measurement windows as your quantitative metrics rather than treating them as separate exercises. When a manager listens to call recordings or reviews session transcripts alongside the KPI dashboard, patterns emerge that pure numbers miss, a specific competitor objection everyone is struggling with, or a discovery question the top performers ask that the rest of the team skips.
Structured coaching notes and rubric scores from practice sessions give you a middle layer between anecdote and spreadsheet. A rubric-based transcript review turns a manager’s gut sense that “the team sounds more confident” into a documented score change tied to a specific skill, which is far more useful in a leadership meeting than either a raw revenue number or a vague impression on its own.
The goal is not to choose between qualitative and quantitative data. It’s to use qualitative input to explain the quantitative shifts, and let the numbers confirm whether the qualitative impressions were actually accurate.
Which ROI calculation method should you use?
Not every method fits every situation, and picking the wrong one can make a good program look weak or a mediocre one look strong.
The simple ROI formula (incremental revenue minus cost, divided by cost) works well for straightforward comparisons and executive reporting, but it depends entirely on how carefully you defined incremental revenue and attribution. Get those wrong and the formula produces a confident, wrong answer.
The cohort comparison method, measuring a trained group against an untrained or later-trained control group, gives you the strongest defense against the “was it really the training?” objection. It takes longer to set up and requires holding back a comparison group, which some organizations resist.
The time-to-quota / ramp calculation works best for onboarding-focused training, converting faster ramp times directly into dollar value. It is less useful for tenured-rep programs where quota attainment is already stable.
A weighted or blended model, combining RPR, win rate, and cycle-time improvements into one composite score, gives leadership a single number but can obscure which specific metric actually drove the result, making it harder to diagnose what worked.
Most CFO-ready reports end up combining two methods: cohort comparison to establish credibility, and the simple ROI formula to communicate the headline number.
How does training ROI fit into overall sales performance management?
Training ROI is not a side project that runs parallel to sales performance management. It should be one input feeding the same system that tracks quota attainment, pipeline health, and forecast accuracy.
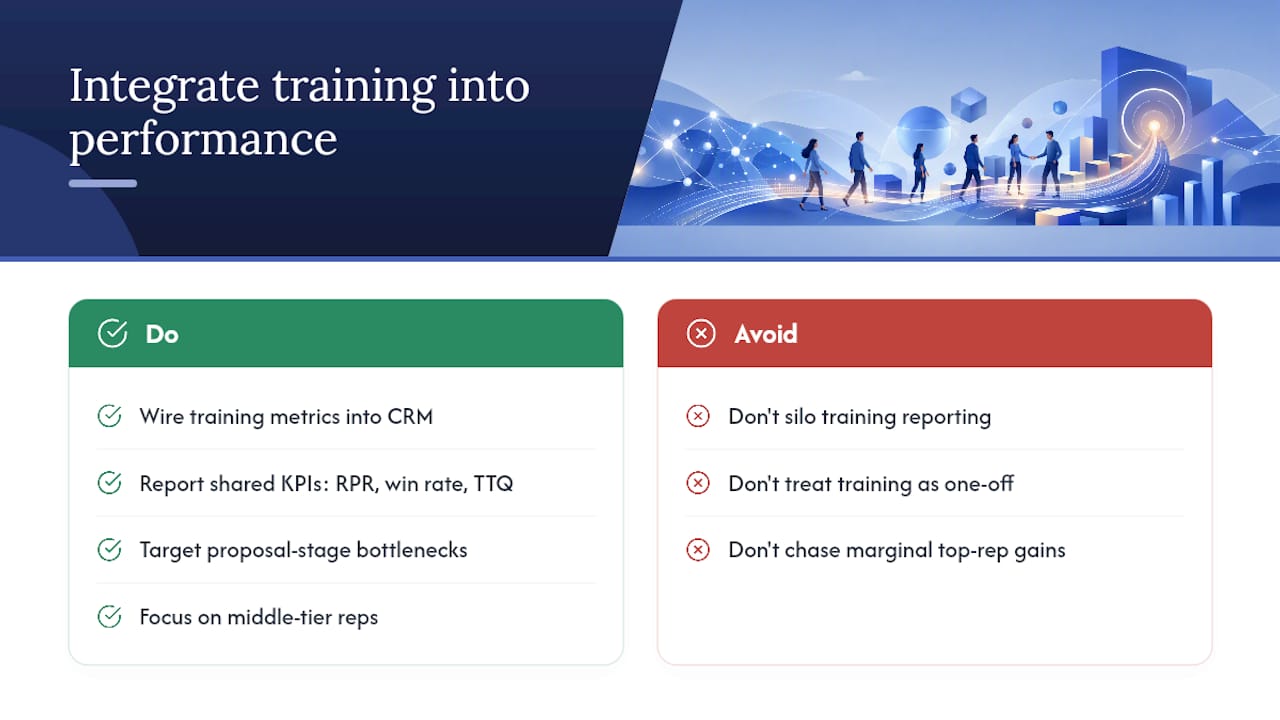
When training metrics live in a separate spreadsheet from your CRM dashboards, leadership sees two disconnected stories: one about training completion, another about revenue. Connect the two, and RPR, win rate, and time-to-quota become shared metrics that both the training function and sales operations report against, which forces alignment on what “improvement” actually means.
This integration also changes how you prioritize future training investment. If performance management data shows the sales cycle is stalling specifically at the proposal stage, that becomes the next training target instead of a generic refresher covering the entire sales process. Elevating middle-tier performers rather than chasing marginal gains among your top reps tends to produce the largest aggregate revenue lift, since a small percentage gain applied across your median performers usually outweighs a large gain among reps already near quota.
Treat training ROI as a recurring input to quarterly business reviews rather than a one-time project report. Programs that get renewed and refined year over year almost always started by wiring their metrics into the sales team’s existing performance dashboards instead of building a standalone reporting process nobody else looks at.
What tools help you track and measure training ROI?
Spreadsheets can calculate the ROI formula, but they cannot capture skill change, call quality, or practice frequency on their own. Measuring training ROI properly usually requires pulling data from a few different systems and reconciling them against a common timeline.
Your CRM remains the source of truth for the lagging indicators: win rate, deal size, and sales cycle length by rep and by cohort. Learning management systems track completion and activity metrics, the Tier 1 data that predicts whether capability gains are likely at all. Neither system, on its own, tells you whether a rep’s discovery skills actually improved.
That capability layer is where practice-based platforms fill the gap. AI-driven roleplay simulators generate scored assessments and transcripts every time a rep practices, giving you a repeatable, dated data point to compare against baseline, something a live coaching session rarely produces at scale since it depends on a manager remembering to score and log it consistently. Benchmarks suggest simulator-based training can surface measurable capability gains within weeks, faster than formats relying solely on quarterly in-person workshops.

Whatever stack you use, the goal is the same: one system for activity, one for capability, one for revenue, all reporting against the same 90 and 180 day windows so you’re not comparing metrics measured on different clocks.
The measurement problem nobody wants to admit
Most sales leaders already believe training works. The harder truth is that most of them cannot prove it, and that gap between belief and evidence is exactly why training budgets get cut the moment a company tightens spending.
The conventional advice tells managers to “track everything.” That’s backwards. Tracking everything produces a dashboard nobody trusts and a report nobody reads past the first slide. The programs that survive budget reviews pick one metric, usually Revenue per Rep, and defend it relentlessly with a real baseline and a real comparison group.
What gets underestimated is how much conservative attribution actually helps your case rather than hurting it.
The other overlooked piece is speed. Capability metrics from structured practice environments show up in weeks, not the six months everyone assumes ROI measurement requires. Reps who get scored, transcript-reviewed feedback on realistic conversations build documented skill evidence long before the revenue numbers catch up, which means you can walk into a 60-day check-in with real data instead of an apology for needing more time.
— Adam
Put measurement-first training to work with XL Roleplay
XL gives sales teams the capability data that most training programs never manage to capture: scored coaching reports, full session transcripts, and readiness scores tied to your own sales methodology, not a generic rubric borrowed from somewhere else. Instead of guessing whether a rep’s objection handling actually improved, you get a dated, comparable score every time they practice, exactly the Tier 2 evidence a defensible ROI calculation needs.
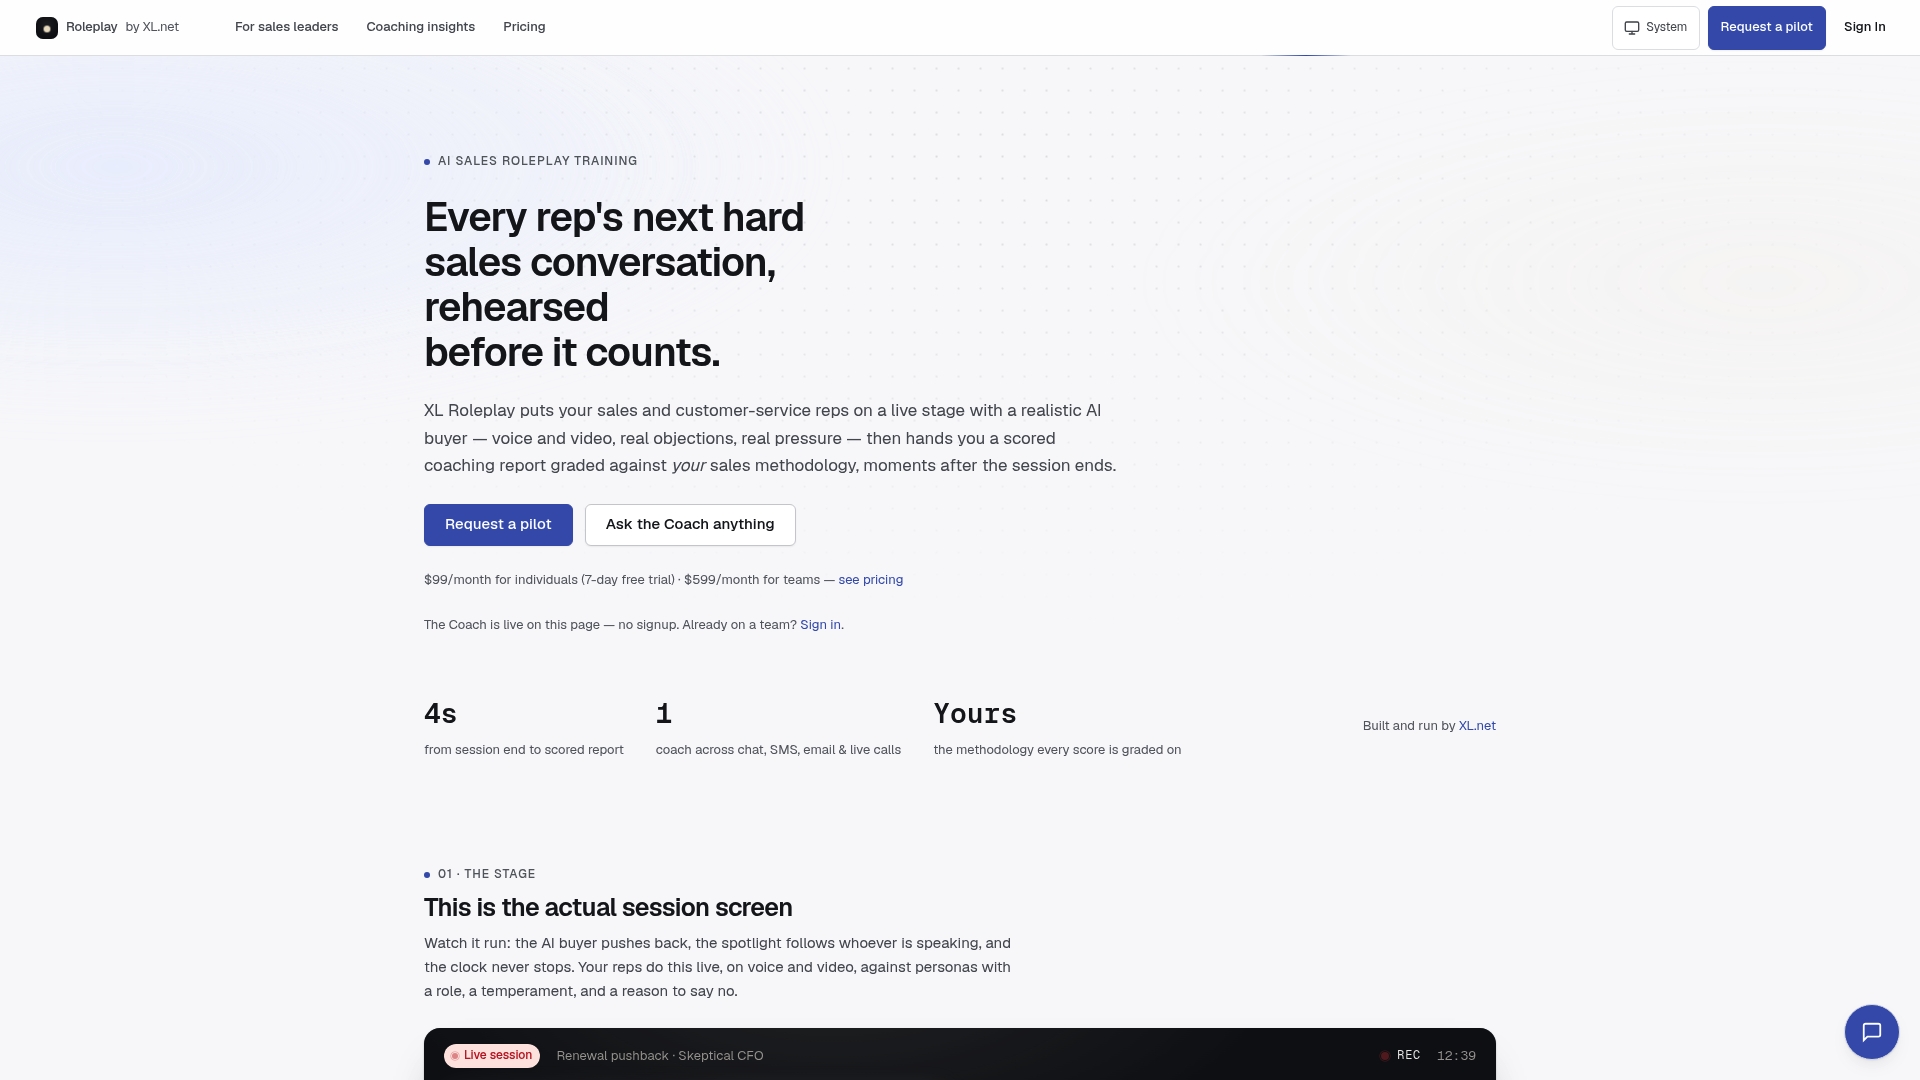
For sales leaders building a 90-day pilot, that means you can set a baseline readiness score this week, run reps through realistic AI buyer conversations that mirror your top three deal risks, and pull a cohort comparison before the quarter ends. Reps get immediate, structured feedback instead of waiting for a manager’s calendar to open up, which shortens the gap between practice and measurable skill change. If you’re ready to see what that baseline looks like for your team, start with a plan built for sales leaders and get your pilot cohort running this month.
Sources
- Sales Training ROI: Turning Investment Into Tangible Results — Forbes
- Sales Training ROI: How to Prove Your Program’s Value With Data-Driven Results — ATD
- The ROI of Sales Training — Objective Management Group
- Sales Training ROI: 3 Formulas + Benchmarks — Pitchbase